Happy Earth Day

Earthrise, Apollo VIII, December 22, 1968
Earthrise, Apollo 8

I remember when we first received images of the earth from space. This image, taken by Apollo VIII astronauts returning to Earth after circumnavigating the moon, was not the first. But, showing the green, wet, full-of-life, and finite Earth in stark contrast to the dry, lifeless Moon, it helped energize the environmental movement.

The rising Earth is about five degrees above the lunar horizon in this telephoto view taken from the Apollo 8 spacecraft near 110 degrees east longitude. The horizon, about 570 kilometers (250 statute miles) from the spacecraft, is near the eastern limb of the Moon as viewed from the Earth. On the earth, the sunset terminator crosses Africa. The south pole is in the white area near the left end of the terminator. North and South America are under the clouds. The lunar surface probably has less pronounced color than indicated by this print.
– NASA Earth Observatory

Gardening by Satellite

Here in Brooklyn, at the end of last week and into the weekend, we got drenched with a couple days of rain. Fellow gardeners in Massachusetts, Vermont, New Hampshire, and Maine, I sympathize.

New England Ice Storm, 2008.12.13

In this image, snow is red and orange, while liquid water is black. By the time this image was taken [On December 13], the top layer of ice was undoubtedly starting to melt, and the resulting watery ice ranges from dark red to black. The icy region extends over parts of Massachusetts, Vermont, and New Hampshire … The normally green-blue tone of plant-covered land is nearly black throughout most of New Hampshire, the state most severely affected by the storm.
New England Ice Storm, NASA Earth Observatory

If you’ve blogged about the ice storm in your area, give us a link!

Links

New England Ice Storm, NASA Earth Observatory

The following Garden Bloggers reported on the ice storm where they are.
Common Weeder, Heath, Massachusetts
Garden Path, Scarborough, Maine
The Vermont Gardener, Marshfield, Vermont

Fall Approaches, 2008

I’ve been watching fall advance locally: first the red of the Dogwoods, the yellow of the Locusts, the psychedelia of the White Ash. When my system gets back up and running, I’ll have some photos of my own to share. Meanwhile, NASA treats us with their annual satellite perspective on the phenomenon. This is how it looked about two weeks ago.

Fall Color in the US Northeast

Fall was beginning to color the East Coast of the United States when the Moderate Resolution Imaging Spectroradiometer (MODIS) on NASA’s Terra satellite captured this image on October 12, 2008. Orange touches trees in the north and at higher elevations, where temperatures are cooler. Lower elevations are still green. The fall color follows the sweep of the Appalachian Mountains through Pennsylvania, New York, and into New England.
Fall Color in the US Northeast, NASA Earth Observatory

The image also illustrates the dense population of the East Coast. Cities are gray in this photo-like image. The greater New York City region covers a large area on the coast. Boston, Massachusetts, and Providence, Rhode Island are also clearly visible.

Related Posts

2007:

2006:

Links

Fall Color in the US Northeast, NASA Earth Observatory

Satellite Image of Northeast’s First Snow of the Season

Satellie view of the first snow in the Northeastern United States

A string of storms brought the season’s first snow to the eastern United States from the mid-Atlantic states to New England during the first week of December 2007. By December 6, most of the clouds had cleared, providing the Moderate Resolution Imaging Spectroradiometer (MODIS) on NASA’s Terra satellite this view of the snow-covered landscape. The snow highlights the contours of the land. Waves and curves follow the gentle folds of the Appalachian Mountains through Virginia, West Virginia, Maryland, and Pennsylvania. The more rugged mountains of New Hampshire, Vermont, and New York wrinkle the surface of the land.
First Snow in the US Northeast, NASA Earth Observatory

The snow also makes rivers and lakes more visible than they might otherwise be. The dark blue-green Finger Lakes of upstate New York pop out against the surrounding white land. The long narrow lakes formed when glaciers scoured, deepened, and eventually dammed stream valleys. The lakes point north and northwest to the shores of Lake Ontario, portions of which are visible beneath a bank of clouds in this image. The northern shore of Lake Erie similarly peaks through the clouds to the west. In the far north, particularly in Maine and Canada, lakes have already started to freeze. The ice is a smooth, bright white surface in contrast to the slightly darker land.

To the south, snow-covered Maryland surrounds the northern Chesapeake Bay, starkly outlining the ragged shoreline where rivers and streams enter the bay. The largest river flowing into the Chesapeake is the Susquehanna, which cuts southeast across the Appalachian Mountains of Pennsylvania.

Here’s a closer view of the NYC area.
Satellie view of the first snow in the NYC area

Related Posts

First Snow of the Season

Links

First Snow in the US Northeast, NASA Earth Observatory

Images: Fires in Southern California

Update 2007.10.24: NASA continues to publish updated satellite imagery of the fires and the natural phenomena driving them. Check the sidebar of their page for “Other Images for this Event”.

By Wednesday morning, 600,000 people had been displaced by the fires. By the afternoon, CNN upped the estimate to over 900,000.


Image acquired 2007.10.22 13:55 PDT

Watching the news this morning before going to work, I was shocked to hear that a quarter of a million people – 250,000 – have been displaced by the fires in California. This satellite image, taken less than 24 hours ago, provides some sense of the scale of what’s going on there.

In what seemed like the blink of an eye, wildfires ignited in the paper-dry, drought-stricken vegetation of Southern California over the weekend of October 20, 2007, and exploded into massive infernos that forced hundreds of thousands of people to evacuate their communities. Driven by Santa Ana winds, fires grew thousands of acres in just one to two days. The fires sped down from the mountains into the outskirts of coastal cities, including San Diego. Dozens of homes have burned to the ground, and at least one person has died, according to local news reports. Several of the fires were burning completely out of control as of October 22.

The drought in the Southwest throughout summer 2007 has been “extreme” according to the categories used by the U.S. Drought Monitor. Dry vegetation and Santa Ana winds, which can reach hurricane force as they race downslope from the deserts of the Great Basin and through narrow mountain passes, are often a devastating combination in Southern California. According to the Incident Management Situation Report [PDF] from the National Interagency Fire Center for October 22, Santa Ana winds were expected to continue through Wednesday.

Fires in Southern California, NASA Earth Observatory

Links
California Fire News (Blog)
CNN Coverage
NASA: Fires in Southern California

We Are All One World

NASA images by Reto Stöckli, based on data.
The Earth, Side B

Spectacular composite images from NASA. If you have the bandwidth, definitely check out the full size renditions (Eastern hemisphere, and my home, the Western hemisphere), each of which is nearly 3MB in size. You’ll feel like you’re floating in space over the earth.

These are not photographs. These are carefully constructed from large databases of images taken at many different times and places.

Drawing on data from multiple satellite missions (not all collected at the same time), a team of NASA scientists and graphic artists created layers of global data for everything from the land surface, to polar sea ice, to the light reflected by the chlorophyll in the billions of microscopic plants that grow in the ocean. They wrapped these layers around a globe, set it against a black background, and simulated the hazy edge of the Earth’s atmosphere (the limb) that appears in astronaut photography of the Earth.

Most of the data layers in this visualization are available as monthly composites as part of NASA’s Blue Marble Next Generation image collection. The images in the collection appear in cylindrical projection (rectangular maps), and they are available at 500-meter resolution. The large images provided above are the full-size versions of these globes. In their hope that these images will inspire people to appreciate the beauty of our home planet and to learn about the Earth system, the developers of these images encourage readers to re-use and re-publish the images freely.

Twin Blue Marbles, NASA Earth Observatory


Links

Blue Marble: Next Generation

Fall Approaches

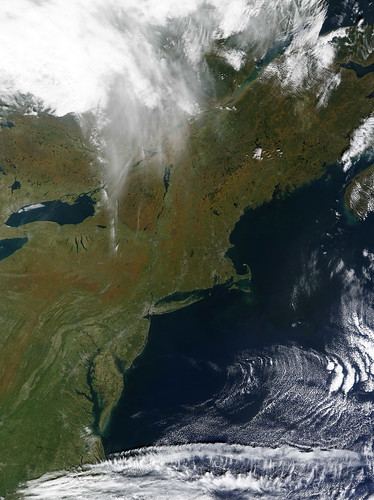
Fall Colors around Lake Superior, September 23, 2007. Credit: NASA TerraMODIS (Satellite-Sensor)

The autumnal equinox of 2007 occurred at 09:51 UTC on Sunday, September 23, or 05:51 Eastern Time. “Autumnal” instead of “Fall” because:

  1. It’s okay to use for both hemispheres.
  2. Also, you could use this term on any other planets on which you should find yourself.

In northeastern North America, we measure fall by the changes in foliage. And it’s on its way south from Canada.

The calendar may have set September 23 as the first day of autumn in 2007, but the forests that line the eastern shore of Lake Superior had already started to mark the turning of the season. By September 23, when the Moderate Resolution Imaging Spectroradiometer (MODIS) on NASA’s Terra satellite captured this photo-like image, the forests of northern Michigan and southern Ontario flamed orange as the first trees of the season—maples—began to display their brilliant red and orange fall colors. Veins of green run through the sea of orange where the deciduous forest gives way to deep green pine trees.

The most vivid color is concentrated in Canada’s Ontario Province. Located farther south, Michigan’s trees show only a hint of color. …

The large image provides an unusually cloud-free view of all of the Great Lakes. Similar spots of color stretch across southern Canada and parts of Michigan, Wisconsin, and Minnesota. The northern plains of the United States have started to turn yellow as grasses ripen, but the eastern forests in Pennsylvania and New York remain deep green.

Fall Colors around Lake Superior, NASA Earth Observatory

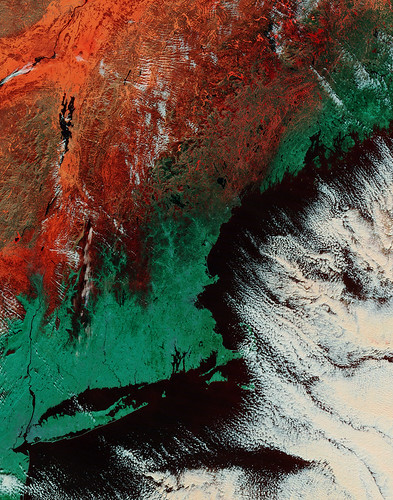
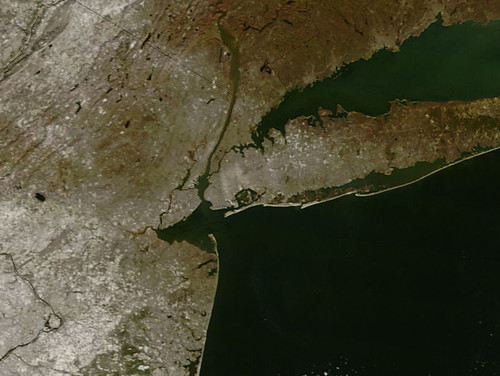
New York State operates its own fall foliage watch. You can track the progress of the changes on the map provided on their Web site. They were predicting “vibrant, near-peak autumn color” this past weekend for the Adirondacks, the peachy area in northern New York state on the map below.

Here in NYC, we’re still in the green, but I’ve been watching the subtle changes. Individual trees in my neighborhood, including the cherry tree in my backyard, are already picking up shades of yellow and orange.

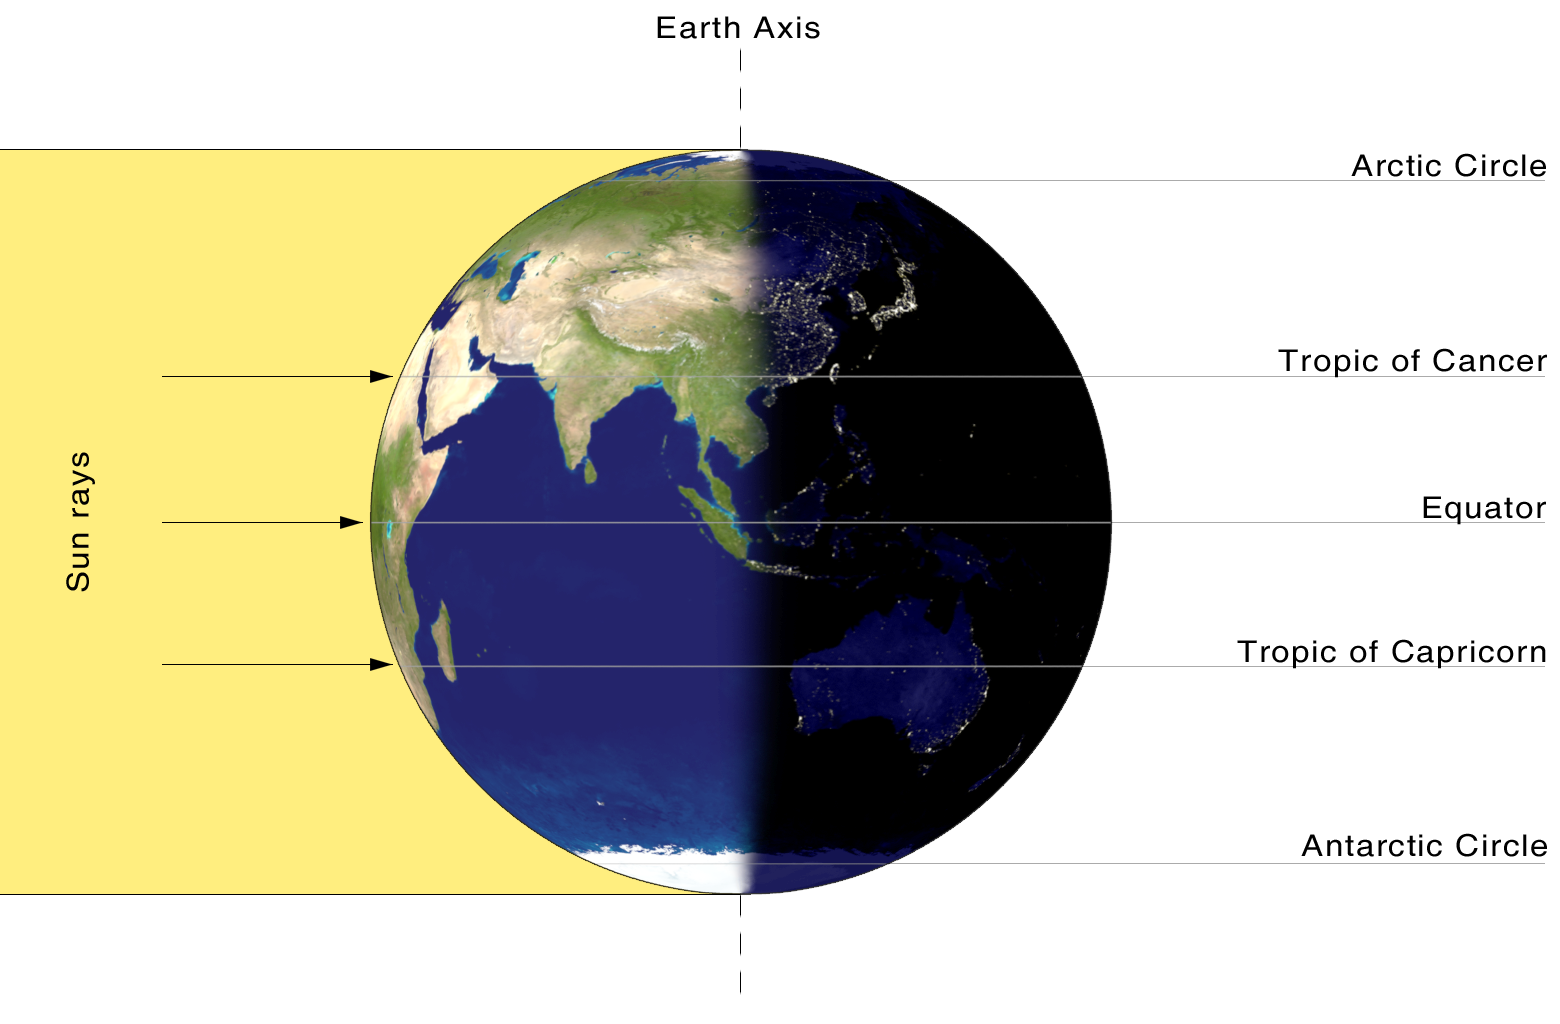
Vernal equinox and autumnal equinox. These names are direct derivatives of Latin (ver = spring, autumnus = autumn), and as such more apt to be found in writings. Although in principle they are subject to the same problem as the spring/autumn names, their use over the centuries has fixed them to the viewpoint of the northern hemisphere. As such the vernal equinox is the equinox where the Sun passes from south to north [across the equator], and is a zeropoint in some celestial coordinate systems. The name of the other equinox is used less often.
– Wikipedia:Equinox:Names

Links

Wikipedia: Equinox
I Love NY (State) Fall Foliage Report

Related Posts

The Return of Persephone

Images: Brooklyn From Space

Astronaut photograph ISS015-E-5483, courtesy of the Image Science & Analysis Laboratory, NASA Johnson Space Center.

Apologies for the dearth of posts of late. I find myself overextended, and needing to regroup. I’ve got a post or two in the works. Meanwhile, here’s a cool astronaut photograph of Brooklyn. The original, uncropped, image covers much more of Brooklyn. You can even see my house! (Not really.)

This astronaut photograph captures the dense urban fabric of Brooklyn, New York City’s largest borough (population of 2.6 million), characterized by the regular pattern of highly reflective building rooftops (white). Two main arteries from Manhattan into Brooklyn—the famous Brooklyn Bridge and neighboring Manhattan Bridge—cross the East River along the left (north) side of the image. The densely built-up landscape contrasts with the East River and Upper New York Bay (image lower right) waterfront areas, recognizable by docks and large industrial loading facilities that extend across the image center from left to right. Much of the shipping traffic has moved to the New Jersey side of New York Bay, a shift that has spurred dismantling and redevelopment of the historic dockyards and waterfront warehouses into residential properties. However, efforts to conserve historic buildings are also ongoing.

The original name for Brooklyn, Breukelen, means “broken land” in Dutch, perhaps in recognition of the highly mixed deposits (boulders, sand, silt, and clay) left behind by the Wisconsin glacier between 20,000 and 90,000 years ago. These deposits form much of Long Island, of which Brooklyn occupies the western tip. This image features one of Brooklyn’s largest green spaces, the Green-Wood Cemetery. The green canopy of the cemetery’s trees contrasts sharply with the surrounding urban land cover. Today, the cemetery also functions as a natural park, and it is an Audubon Sanctuary. Also visible in the image is Governors Island, which served as a strategic military installation for the U.S. Army (1783–1966) and a major U.S. Coast Guard installation (1966–1996). Today the historic fortifications on the island and their surroundings comprise the Governors Island National Monument.

News: First images of noctilucent clouds from space

A view of the North Pole. White and light blue represent noctilucent cloud structures. Black indicates areas where no data is available.
Credit: Cloud Imaging and Particle Size Experiment data processing team at the University of Colorado Laboratory for Atmospheric and Space Physics

These are the first images of noctilucent clouds from space.

The first observations of these “night-shining” clouds by a satellite named “AIM” which means Aeronomy of Ice in the Mesosphere, occurred above 70 degrees north latitude on May 25. People on the ground began seeing the clouds on June 6 over Northern Europe. AIM is the first satellite mission dedicated to the study of these unusual clouds.

These mystifying clouds are called Polar Mesospheric Clouds, or PMCs, when they are viewed from space and referred to as “night-shining” clouds or Noctilucent Clouds, when viewed by observers on Earth. The clouds form in an upper layer of the Earth’s atmosphere called the mesosphere during the Northern Hemisphere’s summer season which began in mid-May and extends through the end of August and are being seen by AIM’s instruments more frequently as the season progresses. They are also seen in the high latitudes during the summer months in the Southern Hemisphere.

This is basic research in earth science. One thing is already known: the clouds are changing.

Very little is known about how these clouds form over the poles, why they are being seen more frequently and at lower latitudes than ever before, or why they have been growing brighter. [emphasis added] AIM will observe two complete cloud seasons over both poles, documenting an entire life cycle of the shiny clouds for the first time.

“It is clear that these clouds are changing, a sign that a part of our atmosphere is changing and we do not understand how, why or what it means,” stated AIM principal investigator James Russell III of Hampton University, Hampton, Va. “These observations suggest a connection with global change in the lower atmosphere and could represent an early warning that our Earth environment is being changed.”

PMCs occur 50 miles/80 km above Earth’s surface. This is at the top of the mesosphere. It’s almost at the thermopause, the boundary between the mesosphere and thermosphere. In the United States, if you travel to this height, you’re considered an astronaut. Just above this is where auroras form. Far below, at 15-35km altitude, in the stratosphere, is the famous ozone layer.

We are so screwed.

2006 was the fifth-warmest year on record

NASA reports that the five warmest years on record were 2005, 1998, 2002, 2003, and 2006. Put another way, four of the fifth warmest years on record occurred in the last five years. And they expect 2007 to be even warmer than 2006.

The top image is a global map showing temperature anomalies during 2006, blue being the coolest and red being the warmest. Areas with cooler-than-average temperatures appear primarily in the northern Pacific Ocean and Southern Ocean, as well as the interior of Antarctica. The very warmest regions appear in the Arctic and the Antarctic Peninsula, which is consistent with climate predictions that global warming will occur more quickly and dramatically in high latitudes. The red colors that dominate the image reveal the overall warmth of 2006 compared to the long-term average.


The graph below the image tracks mean global temperatures compared to the 1951 to 1980 mean. This graph shows two lines, the 5-year mean, indicated in red, and the annual mean, indicated in pink. Temperatures peaked around 1940 then fell in the 1950s. By the early 1980s, temperatures surpassed those of the 1940s and, despite ups and downs from year to year, they continued rising beyond the year 2000.


– NASA Earth Observatory